Variation in Vaccine Uptake
A global pharmaceutical required a tool to understand how vaccination uptake, screening, incidence and demographic and deprivation characteristics are correlated, enabling an analysis of what is driving the variation in vaccine uptake. CF were tasked to build a prototype tool using existing publicly available data that could showcase what would be possible and provide an understanding of what areas would benefit from an intervention. The success of this should lead to wider usage and the support needed for more granular data architecture and information governance to support more frequent and granular data capture.
Our approach
The pharmaceutical company was seeking to eliminate an indication by tracking and maximising the roll-out of its vaccine, which starts with understanding current areas of low uptake, as well as understanding variation in screening and incidence for the therapeutic indication.
What did we do?
- Problem definition: We worked with the client to break down the ambition of eliminating an indication into a number of measurable ambitions across vaccination, screening and incidence, and defined the metrics that would be used to measure progress against each of these ambitions, and how they would be visualised.
- Data landscape: We examined what publicly available data was available to use to answer the problem, and over what time period. We built a single database which incorporated benchmarking metrics and population characteristics at a local authority level.
- Benchmarking metrics: annual vaccination, screening and incidence data
- Population characteristics: deprivation, ethnicity, rurality and education
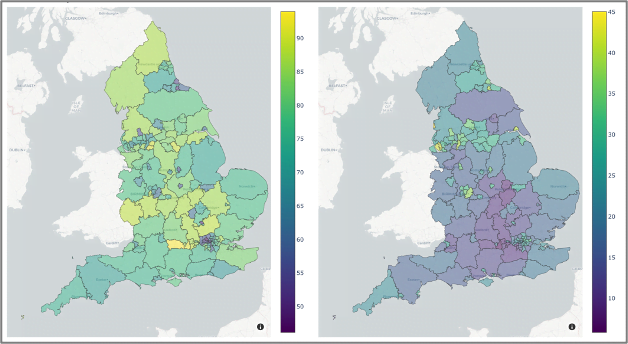
- Tool build: We built the prototype tool in Dash. Using a combination of maps, heatmaps and scatterplots, we built a user-friendly tool that allowed users to immediately understand inequalities in different Integrated Care Systems (ICSs) and local authorities and take action to prevent future cases of disease. Specifically, users were able to:
- Visualise the variation in the key metrics vaccine coverage rates, screening coverage and incidence across all Upper Tier Local Authorities (UTLAs) and ICSs in across the country in a map format, alongside correlating factors
- Filter the UTLAs to show the top performers and bottom performers in each metric
- Compare the performance of an UTLA and/or ICS to its peer group across the key metrics and correlating factors
- Correlate the vaccine coverage rates with a range of population context factors
- Identify outliers where vaccine coverage rates are higher or lower than expected, given their population context
- Engagement: We generated significant interest in the prototype across the pharmaceutical company and the national health system through demonstrations, and gathered feedback on the potential for this prototype and what could be done to improve its effectiveness through more granular and frequent data collection.


